Case study · my own product, built solo
LuBot.ai: An AI analyst that learns you
Small businesses have their numbers everywhere and no analyst to ask what they mean.
LuBot answers questions about your website, your files and your stock portfolio in plain English, with charts and the reasons behind them. The more you use it, the better it knows what you care about.
- 260,000+ lines of code, built solo
- 83 stock analysis tools
- 36 AI workers learning in the background

Before and after
- Export data from each toolpain point
- Build the report by handpain point
- Guess what the numbers meanpain point
- Decide days later
LuBot
- Ask in plain English
- Answer from your own data
- Charts and the why behind them
- It remembers what you care about
A day with LuBot
Alex runs a small online shop and invests on the side. No data team, no analyst. Here is a day with LuBot (an example, every feature is real).
- Morning
LuBot noticed before Alex asked
LuBot is built to watch the website on its own: a spike, a page that suddenly carries all the traffic, a cause hiding inside the averages. Alex gets a short card, not a dashboard to dig through.
Behind this: 36 background AI workers, built in
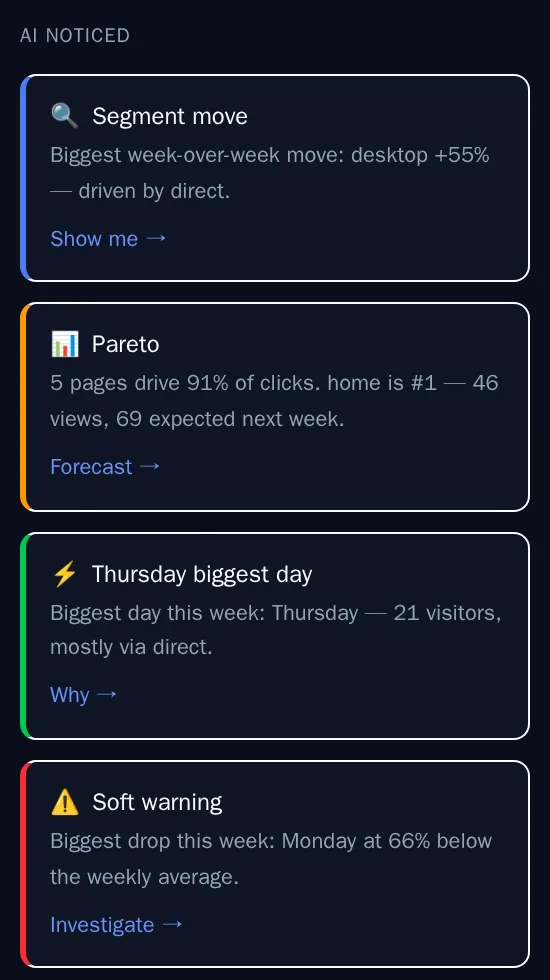
Real LuBot screen · demo website - Mid-morning
“Can I sleep well with my portfolio?”
Alex asks in plain English. LuBot answers with a Sleep Well Score from 0 to 100 and the reasons, compares the stocks the way legendary investors would, and gently points out when a question sounds driven by fear or greed.
Behind this: 83 stock analysis tools, brokerage sync via Plaid (read-only)
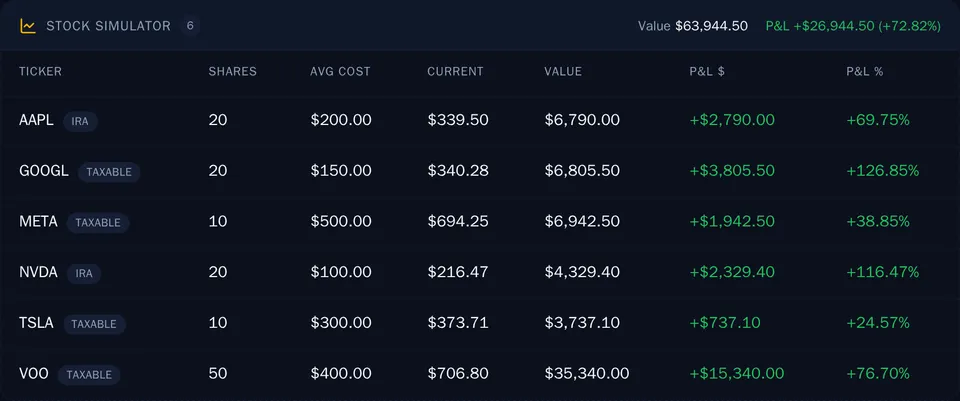
Real LuBot screen · sample portfolio - Afternoon
“What sold best last month?”
Alex drops in a spreadsheet and a PDF. LuBot draws the chart, flags duplicate and empty rows, and shows exactly where each answer came from.
Behind this: One private database just for Alex. The reason Neon wrote about LuBot
- Next day
It already knows Alex
Shorter answers, because Alex likes them short. Suggestions for what to look at next, the way Netflix suggests a show. Every number is computed by code, never guessed by the AI.
Behind this: Memory of each user + 12,000+ automated tests
- Predict next week's traffic
- What pages are losing traffic?
- Compare this week to last week


The full build, by the numbers
- 260,000+ lines of code
- 12,000+ automated tests
- 1,800+ commits since March 2026
- 169 API endpoints
- 84 database tables
- 83 stock analysis tools
- 36 background AI workers
- 24 specialist chat handlers
- 9 tools inside Claude (MCP)
- 3 MCP directories list it
- 1 database per customer
- 1 engineer: me
3 hard problems I solved
Every customer's data stays apart
Each customer gets their own database, so nobody can ever see someone else's numbers, even by mistake.
Neon (Databricks) wrote a case study about this design.
The right AI for each job, and it never goes down
Each question goes to the model that does that job best: Claude, GPT or NVIDIA. If a provider is down, LuBot switches to a backup by itself.
One company's outage doesn't stop the answers.
The AI never does the math
Python calculates every number first. The AI only explains it in plain words.
The numbers in the chat always match the numbers on the screen.
- My role
- Founder and only engineer
- When
- Built solo, 2026
- Built with
- Python · FastAPI · PostgreSQL (Neon) · React · OpenRouter · DeepInfra · MCP · AWS S3
For engineers: how it is built
One FastAPI backend, a React app and an MCP server for Claude. The decisions that matter:
- You ask
- Web app (React)
- Inside Claude (MCP)
- Backend
- FastAPI · 169 endpoints
- 36 background workers
- AI
- OpenRouter: Claude · GPT · Nemotron
- Backups: Groq · OpenAI · NVIDIA NIM
- Embeddings: DeepInfra (text + images)
- Data
- Clerk (sign-in)
- Supabase (admin)
- Neon: 1 database per customer
- AWS S3 + Parquet + DuckDB (files)
- Database per tenant: one Neon Postgres per customer. Plain Postgres SQL only, and all Neon-specific code lives in one file, so the data can move to any Postgres host.
- Best model per task, chosen by benchmark (the SQL planner was tested on 25 real cases before picking). OpenRouter first, with a backup provider when it fails.
- Multimodal embeddings (NVIDIA Nemotron, served by DeepInfra), so pictures inside a PDF can be found too.
- Files live in S3 as Parquet and are queried with DuckDB, with a local disk cache for speed.
- Numbers are computed in Python and handed to the model as labeled fields. The model only writes the words around them.
- 12,000+ automated tests run on every push. CI mirrors production.
Want a plan like this for your business? Get your free AI blueprint in about a minute.