
Performance
Massachusetts School Performance: What Surprised Me in the Data
📍 Project Motivation
I’m always curious how data can challenge what we assume about the world—and this dataset did just that.
As someone passionate about education and insights that drive real change, I wanted to explore how public schools in Massachusetts were performing in 2024.
I used Tableau to build a dashboard and walk through the patterns hiding in the numbers. It’s based on real data from 1,861 schools, covering nearly 1 million students. And what I found… was not always what I expected.
Dataset Source
The dataset comes from the Massachusetts Department of Elementary and Secondary Education (DESE). It includes data on college attendance, class size, graduation rates, and MCAS test scores (Massachusetts’ standardized testing system).
SCHOOL
DATA
👉 download
Full Analysis

Attending College vs Class Size
1. Do Larger Classes Mean Worse Outcomes? Not Here.
The first thing I explored was the average class size vs. the percentage of students attending college.
I assumed smaller classes would lead to better learning—and more kids going to college. But the data said otherwise.
Insight:
Schools with larger class sizes had a higher rate of college attendance.
I visualized this with a scatter plot, and the trend was clear: more students per classroom didn’t lower success rates—in fact, they rose.
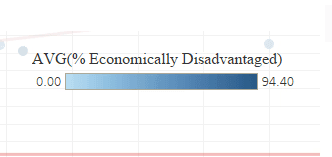
2. Economically Disadvantaged Schools? Strong College Attendance
In the same scatter plot, I layered in which schools were labeled “economically disadvantaged.” These were marked with darker dots.
Surprise:
Many disadvantaged schools had college attendance rates that matched—or even exceeded—other schools.
This challenges common assumptions and shows that with the right support, economic hardship doesn’t have to be a barrier.
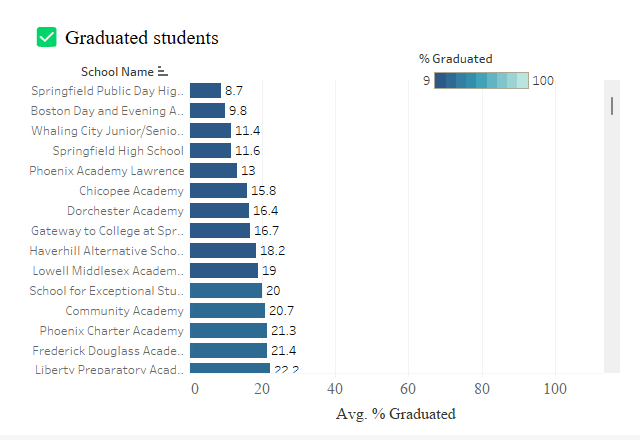
Schools with lowest graduation rate
3. Which Schools Are Struggling with Graduation Rates?
Next, I built a bar chart to spotlight the schools with the lowest graduation rates.
This is important because it gives policymakers and educators a clearer view of which schools may need support.
Comparison Opportunity:
Now that we know who’s struggling, we can also compare them to high-performing schools to ask: What are they doing differently?nomic hardship doesn’t have to be a barrier.
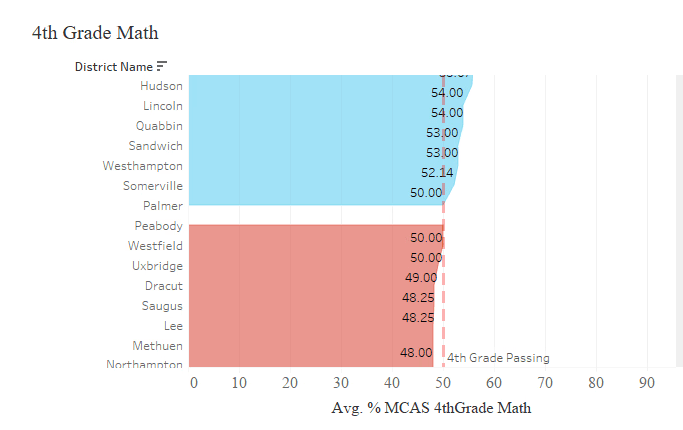
4th Grade Math Performance %
4. How Are 4th Graders Doing in Math?
For my final view, I examined 4th grade math performance on the MCAS test.
I split the results at 50% passing to create a quick visual signal—schools above that are in blue, those below in red.
Impact:
This chart quickly reveals where the strongest and weakest areas are for foundational math skills.
It’s simple but effective for school leaders and parents alike.
Key Takeaways
Surprisingly, schools with larger class sizes actually had higher college attendance rates, challenging the usual assumption that smaller classes are always better.
Being labeled economically disadvantaged didn’t necessarily lead to lower outcomes—many of these schools performed just as well or even better than others.
Graduation rates varied significantly, highlighting that some schools are in urgent need of targeted support and intervention.
A large number of schools are still struggling with basic math proficiency among 4th graders, especially in foundational skills critical for future success.
Why This Project Matters
This isn’t just a dashboard—it’s a decision-making tool.
If you're in education, policy, or data-driven roles, this kind of insight can help you see the bigger picture and drive real change.
Want the Full Walkthrough?
I also created a video demo where I break it all down step by step—showing how data turns into decisions.
Watch Full Dashboard Walkthrough (2:58)
Let’s Build Smarter—and Bigger—with Data
Hi, I’m Lubo Bali—a data analyst who turns spreadsheets into stories and insights into action.
Whether you’re hiring, need contract support, or simply want to connect around education, public impact, or data-driven strategy, I’d love to chat.


Let’s Build Smarter—and Bigger—with Data
Hi, I’m Lubo Bali—a data analyst who turns spreadsheets into stories and insights into action.
Whether you’re hiring, need contract support, or simply want to connect around education, public impact, or data-driven strategy, I’d love to chat.
Want the Full Walkthrough?
I also created a video demo where I break it all down step by step—showing how data turns into decisions.
Watch Full Dashboard Walkthrough (2:58)
Why This Project Matters
This isn’t just a dashboard—it’s a decision-making tool.
If you're in education, policy, or data-driven roles, this kind of insight can help you see the bigger picture and drive real change.
Key Takeaways
Surprisingly, schools with larger class sizes actually had higher college attendance rates, challenging the usual assumption that smaller classes are always better.
Being labeled economically disadvantaged didn’t necessarily lead to lower outcomes—many of these schools performed just as well or even better than others.
Graduation rates varied significantly, highlighting that some schools are in urgent need of targeted support and intervention.
A large number of schools are still struggling with basic math proficiency among 4th graders, especially in foundational skills critical for future success.
4th Grade Math Performance %
4th Grade Math Performance %
Schools with lowest graduation rate
Schools with lowest graduation rate
Attending College vs Class Size
Attending College vs Class Size

Massachusetts School Performance: What Surprised Me in the Data
📍 Project Motivation
I’m always curious how data can challenge what we assume about the world—and this dataset did just that.
As someone passionate about education and insights that drive real change, I wanted to explore how public schools in Massachusetts were performing in 2024.
I used Tableau to build a dashboard and walk through the patterns hiding in the numbers. It’s based on real data from 1,861 schools, covering nearly 1 million students. And what I found… was not always what I expected.
Dataset Source
The dataset comes from the Massachusetts Department of Elementary and Secondary Education (DESE). It includes data on college attendance, class size, graduation rates, and MCAS test scores (Massachusetts’ standardized testing system).
Full Analysis
1. Do Larger Classes Mean Worse Outcomes? Not Here.
The first thing I explored was the average class size vs. the percentage of students attending college.
I assumed smaller classes would lead to better learning—and more kids going to college. But the data said otherwise.
Insight:
Schools with larger class sizes had a higher rate of college attendance.
I visualized this with a scatter plot, and the trend was clear: more students per classroom didn’t lower success rates—in fact, they rose.
2. Economically Disadvantaged Schools? Strong College Attendance
In the same scatter plot, I layered in which schools were labeled “economically disadvantaged.” These were marked with darker dots.
Surprise:
Many disadvantaged schools had college attendance rates that matched—or even exceeded—other schools.
This challenges common assumptions and shows that with the right support, economic hardship doesn’t have to be a barrier.
3. Which Schools Are Struggling with Graduation Rates?
Next, I built a bar chart to spotlight the schools with the lowest graduation rates.
This is important because it gives policymakers and educators a clearer view of which schools may need support.
Comparison Opportunity:
Now that we know who’s struggling, we can also compare them to high-performing schools to ask: What are they doing differently?nomic hardship doesn’t have to be a barrier.
4. How Are 4th Graders Doing in Math?
For my final view, I examined 4th grade math performance on the MCAS test.
I split the results at 50% passing to create a quick visual signal—schools above that are in blue, those below in red.
Impact:
This chart quickly reveals where the strongest and weakest areas are for foundational math skills.
It’s simple but effective for school leaders and parents alike.