Are You Ready to Hire Me?
If you’ve made it this far, you’ve seen how I approach data with curiosity, structure, and clear insights.
This project wasn’t just about HR — it was about asking the right questions, using the right tools (like R and statistics), and turning raw data into meaningful takeaways for both business and people.
I’m ready to bring this mindset to your team.
👉 Whether you're hiring for data analysis, business insights, or strategy support — let's connect.
View my full portfolio at lubobali.com or reach out on LinkedIn.
Let’s build something smart together.

What Employees and HR Can Take Away from This Project?
For Employees:
Experience matters more than age.
Your salary growth is strongly tied to how many years of total work experience you bring — not just how old you are.Switching jobs doesn’t hurt income.
Number of companies worked had little to no negative impact on income.Younger employees are more likely to leave.
If you're early in your career, be aware of how age-related attrition trends could affect your path — or how others may perceive it.
For HR Professionals:
Age is not the full picture.
Retention strategies should be based on experience level, not assumptions about age.Education has weak predictive power.
While education level is important, it doesn’t strongly influence income or attrition on its own.Data can bust myths.
Common beliefs like “new hires get fired more” were not supported by the data. Use statistical evidence to guide people decisions — not gut feelings.


Is experience (TotalWorkingYears) a stronger predictor of income than Age?
Experience (TotalWorkingYears) is a much stronger predictor of income than Age.
When both variables are included, Age loses its power, while experience remains highly significant.
This confirms that income is more tied to what you’ve done (TotalWorkingYears) than how long you’ve lived (Age).
It also shows that Age was acting as a proxy for experience in the previous model.
Conclusion:
Want to predict someone’s salary accurately? Don’t just look at their age — look at how much experience they actually have.
What is the output?
TotalWorkingYears has a strong positive effect — each year adds ~$489 to income on average.
Age becomes slightly negative after controlling for experience, suggesting it’s no longer a strong predictor on its own.
Model R² jumps to ~60%, meaning this model explains far more of the variation in income than using Age alone.
What code did I run ? and
To test whether TotalWorkingYears is a stronger predictor of MonthlyIncome than Age, I ran a multiple linear regression using both variables together:
predictor of MonthlyIncome.

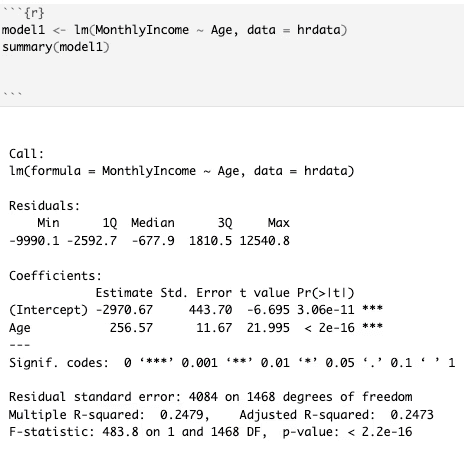
Does Age predict how much income an employee makes?
Yes — Age does predict MonthlyIncome to a certain degree. But while the relationship is statistically strong (very low p-value), it's not the whole story.
Age is a meaningful factor, but it doesn’t explain everything.
With only 25% of the variance explained, other variables (like TotalWorkingYears) may be more powerful predictors.
This led to the next step: adding more variables to improve the model.
Conclusion:
Age alone gives us a rough idea of salary trends — but it’s only part of the picture.
What is the output ?
The regression coefficient for Age is 256.57, meaning income increases by ~$257 per year of age on average.
The model is statistically significant (p-value < 2e-16).
The R² = 0.25, meaning Age explains about 25% of the variation in MonthlyIncome.
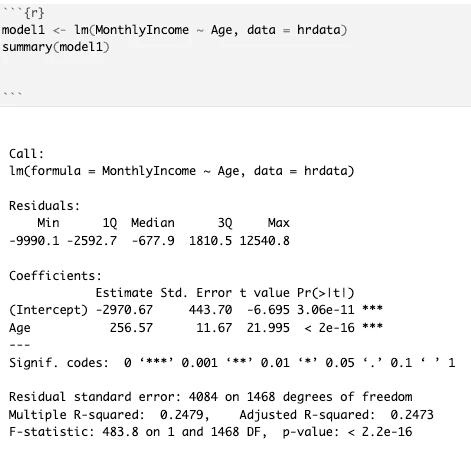
What code did I run ? and
To test if an employee’s age predicts their monthly income, I ran a simple linear regression using R’s lm() function. Then I summarized the model to inspect the results.
This model tests whether Age is a statistically significant predictor of MonthlyIncome.
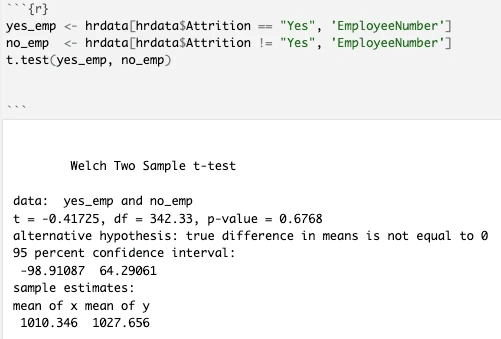
Did newer employees (with lower EmployeeNumbers) get fired more often?
Despite the rumor that “newer employees got fired more,” the data says otherwise.
The average EmployeeNumber was very close between the two groups.
The p-value = 0.6768 is large, which means there’s no statistically significant difference.
The confidence interval includes zero, supporting the conclusion that the difference could be random.
Conclusion:
There’s no strong evidence that newer employees were let go more often — this disproves the assumption and supports a data-driven view of attrition.

What code did I run ? and
What is the output ?
To test whether newer employees (with lower EmployeeNumbers) were more likely to leave, I performed a t-test comparing the average EmployeeNumber of those who left vs. those who stayed.
Here’s the code:
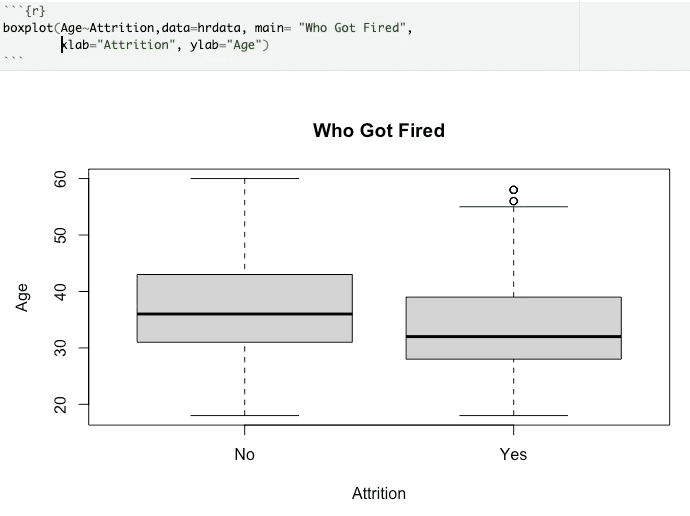
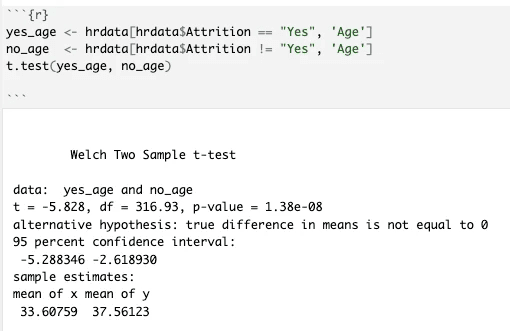
Are employees who left the company younger than those who stayed?
The data clearly shows that employees who left the company were on average about 4 years younger than those who stayed.
The difference is statistically significant (very small p-value), which means it’s extremely unlikely to be due to random chance.
Younger employees might be more likely to resign or be let go
This insight is important for HR teams trying to retain early-career talent
This justified deeper analysis into whether age or other factors (like experience) better predict income and attrition risk.
What code did I run?
A boxplot to visualize the age distribution by attrition status:
A t-test to statistically compare average age between employees who left vs. stayed:

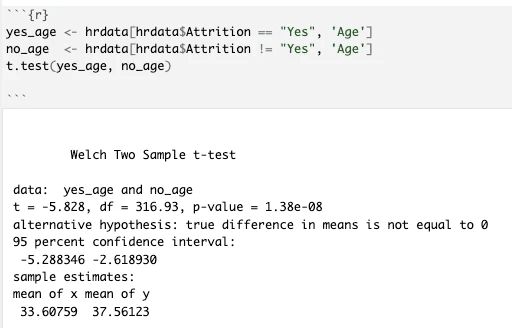
What is the output?
The boxplot showed that employees who left the company had a lower median age than those who stayed.
The t-test gave this result:
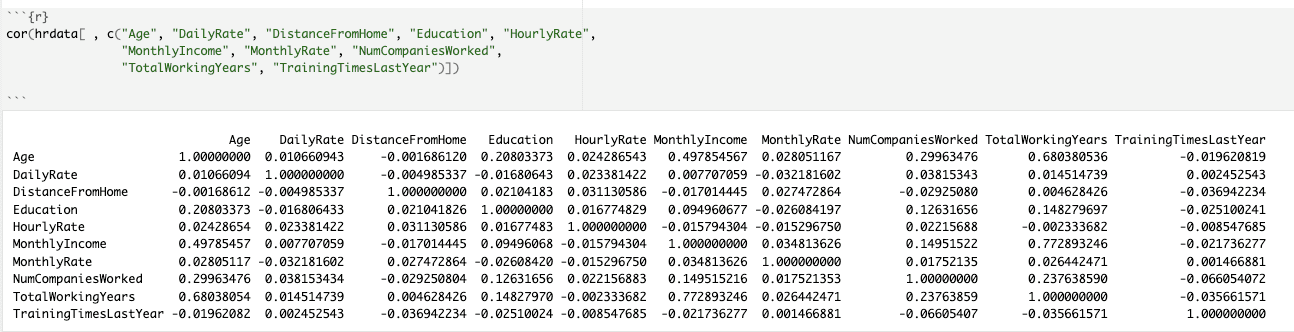
What factors are most strongly correlated with MonthlyIncome?
Experience (TotalWorkingYears) is the most important factor linked to income.
Age plays a role, but mostly because it’s correlated with experience.
Education has a weak correlation with income.
These results helped narrow down which features to include in further analysis and regression models.
The combination of numeric and visual correlation helped me focus on what really matters for salary prediction and attrition analysis.
What code did I run?
To examine which factors might influence MonthlyIncome, I ran this correlation matrix using R:
This generated a correlation table comparing all key numeric features.
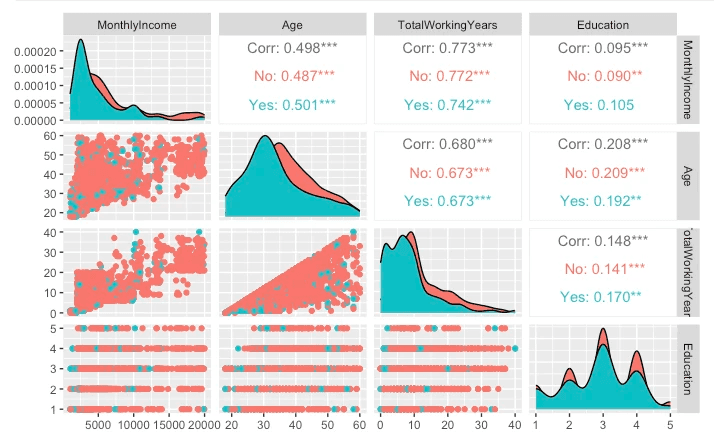
Then, I created a ggpairs() matrix to visually explore these relationships by Attrition status:
What is the output?
Correlation Matrix (Raw Table)
TotalWorkingYears&MonthlyIncome: 0.77Age&MonthlyIncome: 0.50Education&MonthlyIncome: 0.09Other variables like HourlyRate and DistanceFromHome showed near-zero correlation with income.
ggpairs() Matrix (Visual)
Confirmed the strong linear trend between MonthlyIncome and TotalWorkingYears.
Showed distribution shifts for Age and Education depending on Attrition (Yes/No).
Let me quickly compare leavers vs stayers using color-coded density curves and scatterplots.
What & Where of Dataset
The This project uses the IBM HR Analytics Employee Attrition & Performance dataset, originally published on Kaggle.
It’s a fictional but realistic dataset created by IBM data scientists to help explore HR challenges like employee attrition, satisfaction, and salary trends. The dataset includes 1,470 employee records with fields such as age, education level, monthly income, total working years, job role, and whether the employee stayed or left.
This rich set of variables makes it ideal for performing statistical tests, building regression models, and discovering what truly impacts career outcomes within a company.

Think You Know What Affects Your Career?
Should you worry about your age—or how long you’ve been at your company?
Are new hires a threat to your role, or is it all about skill and productivity?
In this project, I dig into those questions using real HR data and statistical analysis in R. I’ll break down what really influences income and who’s more likely to leave a company. By the end, I’ll even build a prediction model to estimate how much your salary could grow each year.
Curious? Stick with me. You might learn something about yourself—or your workplace.


Why THIS Project?
I wanted more than just practice with R — I wanted to uncover real insights about what drives people to stay or leave a company. That’s why this IBM HR dataset caught my eye. It gave me a realistic way to dig into the questions companies (and employees) actually care about:
💼 Does age impact salary?
📈 Is experience more valuable than seniority?
🚪 Can we spot early signs of attrition?
This project helped me strengthen my statistical skills using t-tests, regressions, and visualizations — but more importantly, it gave me a lens into the human side of workplace data.
Are You Ready to Hire Me?
If you’ve made it this far, you’ve seen how I approach data with curiosity, structure, and clear insights.
This project wasn’t just about HR — it was about asking the right questions, using the right tools (like R and statistics), and turning raw data into meaningful takeaways for both business and people.
I’m ready to bring this mindset to your team.
👉 Whether you're hiring for data analysis, business insights, or strategy support — let's connect.
View my full portfolio at lubobali.com or reach out on LinkedIn.
Let’s build something smart together.

What Employees and HR Can Take Away from This Project?
For Employees:
Experience matters more than age.
Your salary growth is strongly tied to how many years of total work experience you bring — not just how old you are.Switching jobs doesn’t hurt income.
Number of companies worked had little to no negative impact on income.Younger employees are more likely to leave.
If you're early in your career, be aware of how age-related attrition trends could affect your path — or how others may perceive it.
For HR Professionals:
Age is not the full picture.
Retention strategies should be based on experience level, not assumptions about age.Education has weak predictive power.
While education level is important, it doesn’t strongly influence income or attrition on its own.Data can bust myths.
Common beliefs like “new hires get fired more” were not supported by the data. Use statistical evidence to guide people decisions — not gut feelings.


Is experience (TotalWorkingYears) a stronger predictor of income than Age?
Experience (TotalWorkingYears) is a much stronger predictor of income than Age.
When both variables are included, Age loses its power, while experience remains highly significant.
This confirms that income is more tied to what you’ve done (TotalWorkingYears) than how long you’ve lived (Age).
It also shows that Age was acting as a proxy for experience in the previous model.
Conclusion:
Want to predict someone’s salary accurately? Don’t just look at their age — look at how much experience they actually have.
What code did I run ? and
To test whether TotalWorkingYears is a stronger predictor of MonthlyIncome than Age, I ran a multiple linear regression using both variables together:
predictor of MonthlyIncome.

What is the output?
TotalWorkingYears has a strong positive effect — each year adds ~$489 to income on average.
Age becomes slightly negative after controlling for experience, suggesting it’s no longer a strong predictor on its own.
Model R² jumps to ~60%, meaning this model explains far more of the variation in income than using Age alone.
Does Age predict how much income an employee makes?
Yes — Age does predict MonthlyIncome to a certain degree. But while the relationship is statistically strong (very low p-value), it's not the whole story.
Age is a meaningful factor, but it doesn’t explain everything.
With only 25% of the variance explained, other variables (like TotalWorkingYears) may be more powerful predictors.
This led to the next step: adding more variables to improve the model.
Conclusion:
Age alone gives us a rough idea of salary trends — but it’s only part of the picture.
What code did I run ? and
To test if an employee’s age predicts their monthly income, I ran a simple linear regression using R’s lm() function. Then I summarized the model to inspect the results.
This model tests whether Age is a statistically significant predictor of MonthlyIncome.
What is the output ?
The regression coefficient for Age is 256.57, meaning income increases by ~$257 per year of age on average.
The model is statistically significant (p-value < 2e-16).
The R² = 0.25, meaning Age explains about 25% of the variation in MonthlyIncome.
Did newer employees (with lower EmployeeNumbers) get fired more often?
Despite the rumor that “newer employees got fired more,” the data says otherwise.
The average EmployeeNumber was very close between the two groups.
The p-value = 0.6768 is large, which means there’s no statistically significant difference.
The confidence interval includes zero, supporting the conclusion that the difference could be random.
Conclusion:
There’s no strong evidence that newer employees were let go more often — this disproves the assumption and supports a data-driven view of attrition.
What code did I run ? and
What is the output ?
To test whether newer employees (with lower EmployeeNumbers) were more likely to leave, I performed a t-test comparing the average EmployeeNumber of those who left vs. those who stayed.
Here’s the code:
Are employees who left the company younger than those who stayed?
The data clearly shows that employees who left the company were on average about 4 years younger than those who stayed.
The difference is statistically significant (very small p-value), which means it’s extremely unlikely to be due to random chance.
Younger employees might be more likely to resign or be let go
This insight is important for HR teams trying to retain early-career talent
This justified deeper analysis into whether age or other factors (like experience) better predict income and attrition risk.
What code did I run?
A boxplot to visualize the age distribution by attrition status:
A t-test to statistically compare average age between employees who left vs. stayed:
What is the output?
The boxplot showed that employees who left the company had a lower median age than those who stayed.
The t-test gave this result:
What code did I run?
To examine which factors might influence MonthlyIncome, I ran this correlation matrix using R:
This generated a correlation table comparing all key numeric features.
What factors are most strongly correlated with MonthlyIncome?
I wanted more than just practice with R — I wanted to uncover real insights about what drives people to stay or leave a company. That’s why this IBM HR dataset caught my eye. It gave me a realistic way to dig into the questions companies (and employees) actually care about:
💼 Does age impact salary?
📈 Is experience more valuable than seniority?
🚪 Can we spot early signs of attrition?
This project helped me strengthen my statistical skills using t-tests, regressions, and visualizations — but more importantly, it gave me a lens into the human side of workplace data.
What is the output?
Correlation Matrix (Raw Table)
TotalWorkingYears&MonthlyIncome: 0.77Age&MonthlyIncome: 0.50Education&MonthlyIncome: 0.09Other variables like HourlyRate and DistanceFromHome showed near-zero correlation with income.
ggpairs() Matrix (Visual)
Confirmed the strong linear trend between MonthlyIncome and TotalWorkingYears.
Showed distribution shifts for Age and Education depending on Attrition (Yes/No).
Let me quickly compare leavers vs stayers using color-coded density curves and scatterplots.
What code did I run?
To examine which factors might influence MonthlyIncome, I ran this correlation matrix using R:
This generated a correlation table comparing all key numeric features.
Then, I created a ggpairs() matrix to visually explore these relationships by Attrition status:
Full Analysis – What I Asked the IBM Data


What & Where of Dataset
This project uses the IBM HR Analytics Employee Attrition & Performance dataset, originally published on Kaggle.
It’s a fictional but realistic dataset created by IBM data scientists to help explore HR challenges like employee attrition, satisfaction, and salary trends. The dataset includes 1,470 employee records with fields such as age, education level, monthly income, total working years, job role, and whether the employee stayed or left.
This rich set of variables makes it ideal for performing statistical tests, building regression models, and discovering what truly impacts career outcomes within a company.


Think You Know What Affects Your Career?
Should you worry about your age—or how long you’ve been at your company?
Are new hires a threat to your role, or is it all about skill and productivity?
In this project, I dig into those questions using real HR data and statistical analysis in R. I’ll break down what really influences income and who’s more likely to leave a company. By the end, I’ll even build a prediction model to estimate how much your salary could grow each year.
Curious? Stick with me. You might learn something about yourself—or your workplace.

Why I Did This Project
I wanted to go deeper into statistical analysis using R, and this IBM HR dataset immediately caught my attention. It gave me a realistic way to explore what actually matters in a company when it comes to employee satisfaction, income, and turnover.
Beyond practicing tools like t-tests and linear regression, I was curious to answer big questions:
Does age affect how much people earn? Is experience more important than seniority? And are there early signals before someone leaves a job?
This project let me blend technical skill-building with real-world HR insights.
The Truth About Age, Experience, and Income in the Workplace

Full Analysis – What I Asked the IBM Data