What This Project Says About My Data Mindset
Did you know that small households — or even single customers — spend way more on delivery and store purchases than larger families? I used real DoorDash customer data to find out how family size and purchase method (store, web, or catalog) impact total spending. This project unpacks the story behind the numbers, with Excel-powered analysis and clear takeaways for businesses and marketers alike.

Project Motivation
I wanted to understand how household size influences customer spending — a question that blends consumer behavior with real business impact. This Excel-based project let me analyze over 2,000 DoorDash customers and explore how family composition affects ordering habits across store, web, and catalog channels.
Beyond sharpening my technical skills with pivot tables, filtering, and charting, the insights uncovered here have broader applications: any food delivery company could use this type of analysis to better target customer segments, improve retention, and grow their reputation
About the Dataset
This project was powered by a real-world customer dataset pulled from GitHub — featuring 2,022 rows and 41 columns packed with behavioral insights.
It includes:
Customer demographics
Total spending across store, web, and catalog channels
Number of kids and teens in the home
This data provided the ideal foundation to practice segmentation, build visual comparisons, and uncover patterns in consumer spending behavior.
👉Downloand

Key Questions
Which purchasing channel is used most: store, web, or catalog?
Is there a correlation between catalog and store purchases?
Is there a correlation between web and store purchases?
Is there a correlation between web and catalog purchases?
How does the number of kids or teens at home affect total spending?
Which purchasing channel is used most: store, web, or catalog?
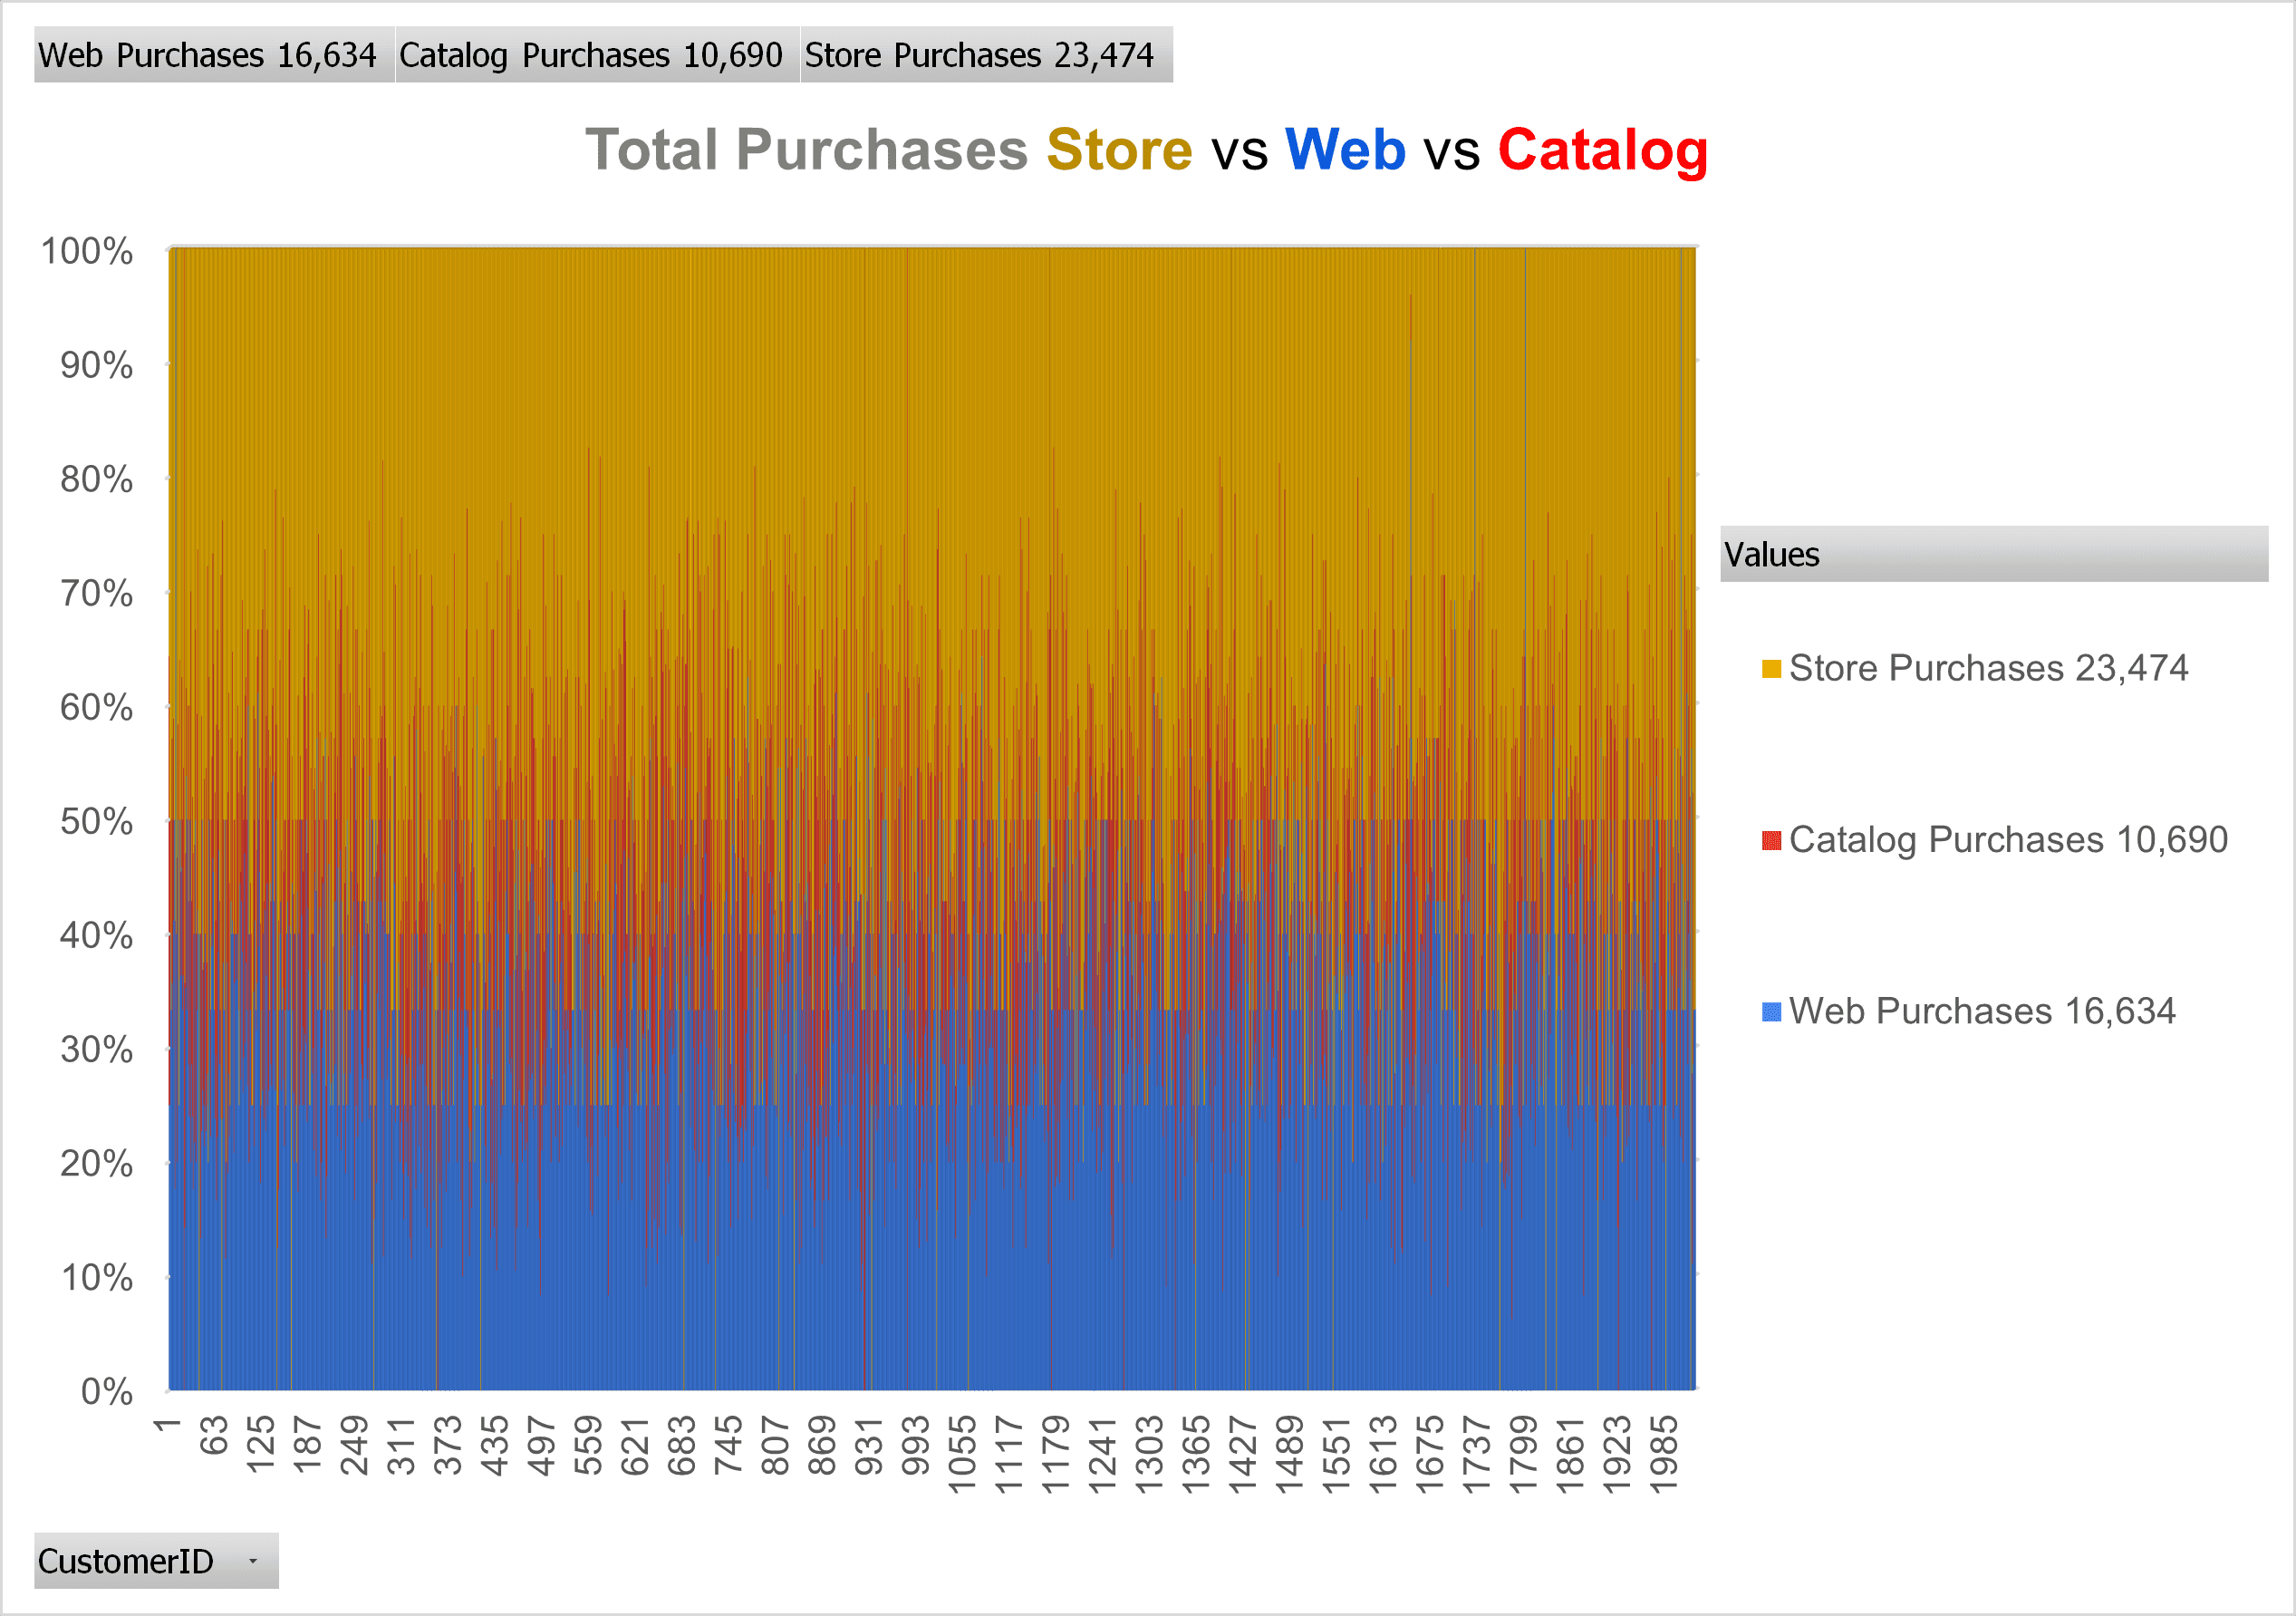
Store purchases dominate. With 23,474 orders, the store channel significantly outpaces both web (16,634) and catalog (10,690) orders. Despite the digital shift, in-person shopping still leads, showing the value of maintaining strong physical operations.
Which purchasing channel is used most: store, web, or catalog?
Store purchases dominate. With 23,474 orders, the store channel significantly outpaces both web (16,634) and catalog (10,690) orders. Despite the digital shift, in-person shopping still leads, showing the value of maintaining strong physical operations.
2. Is there a correlation between catalog and store purchases?
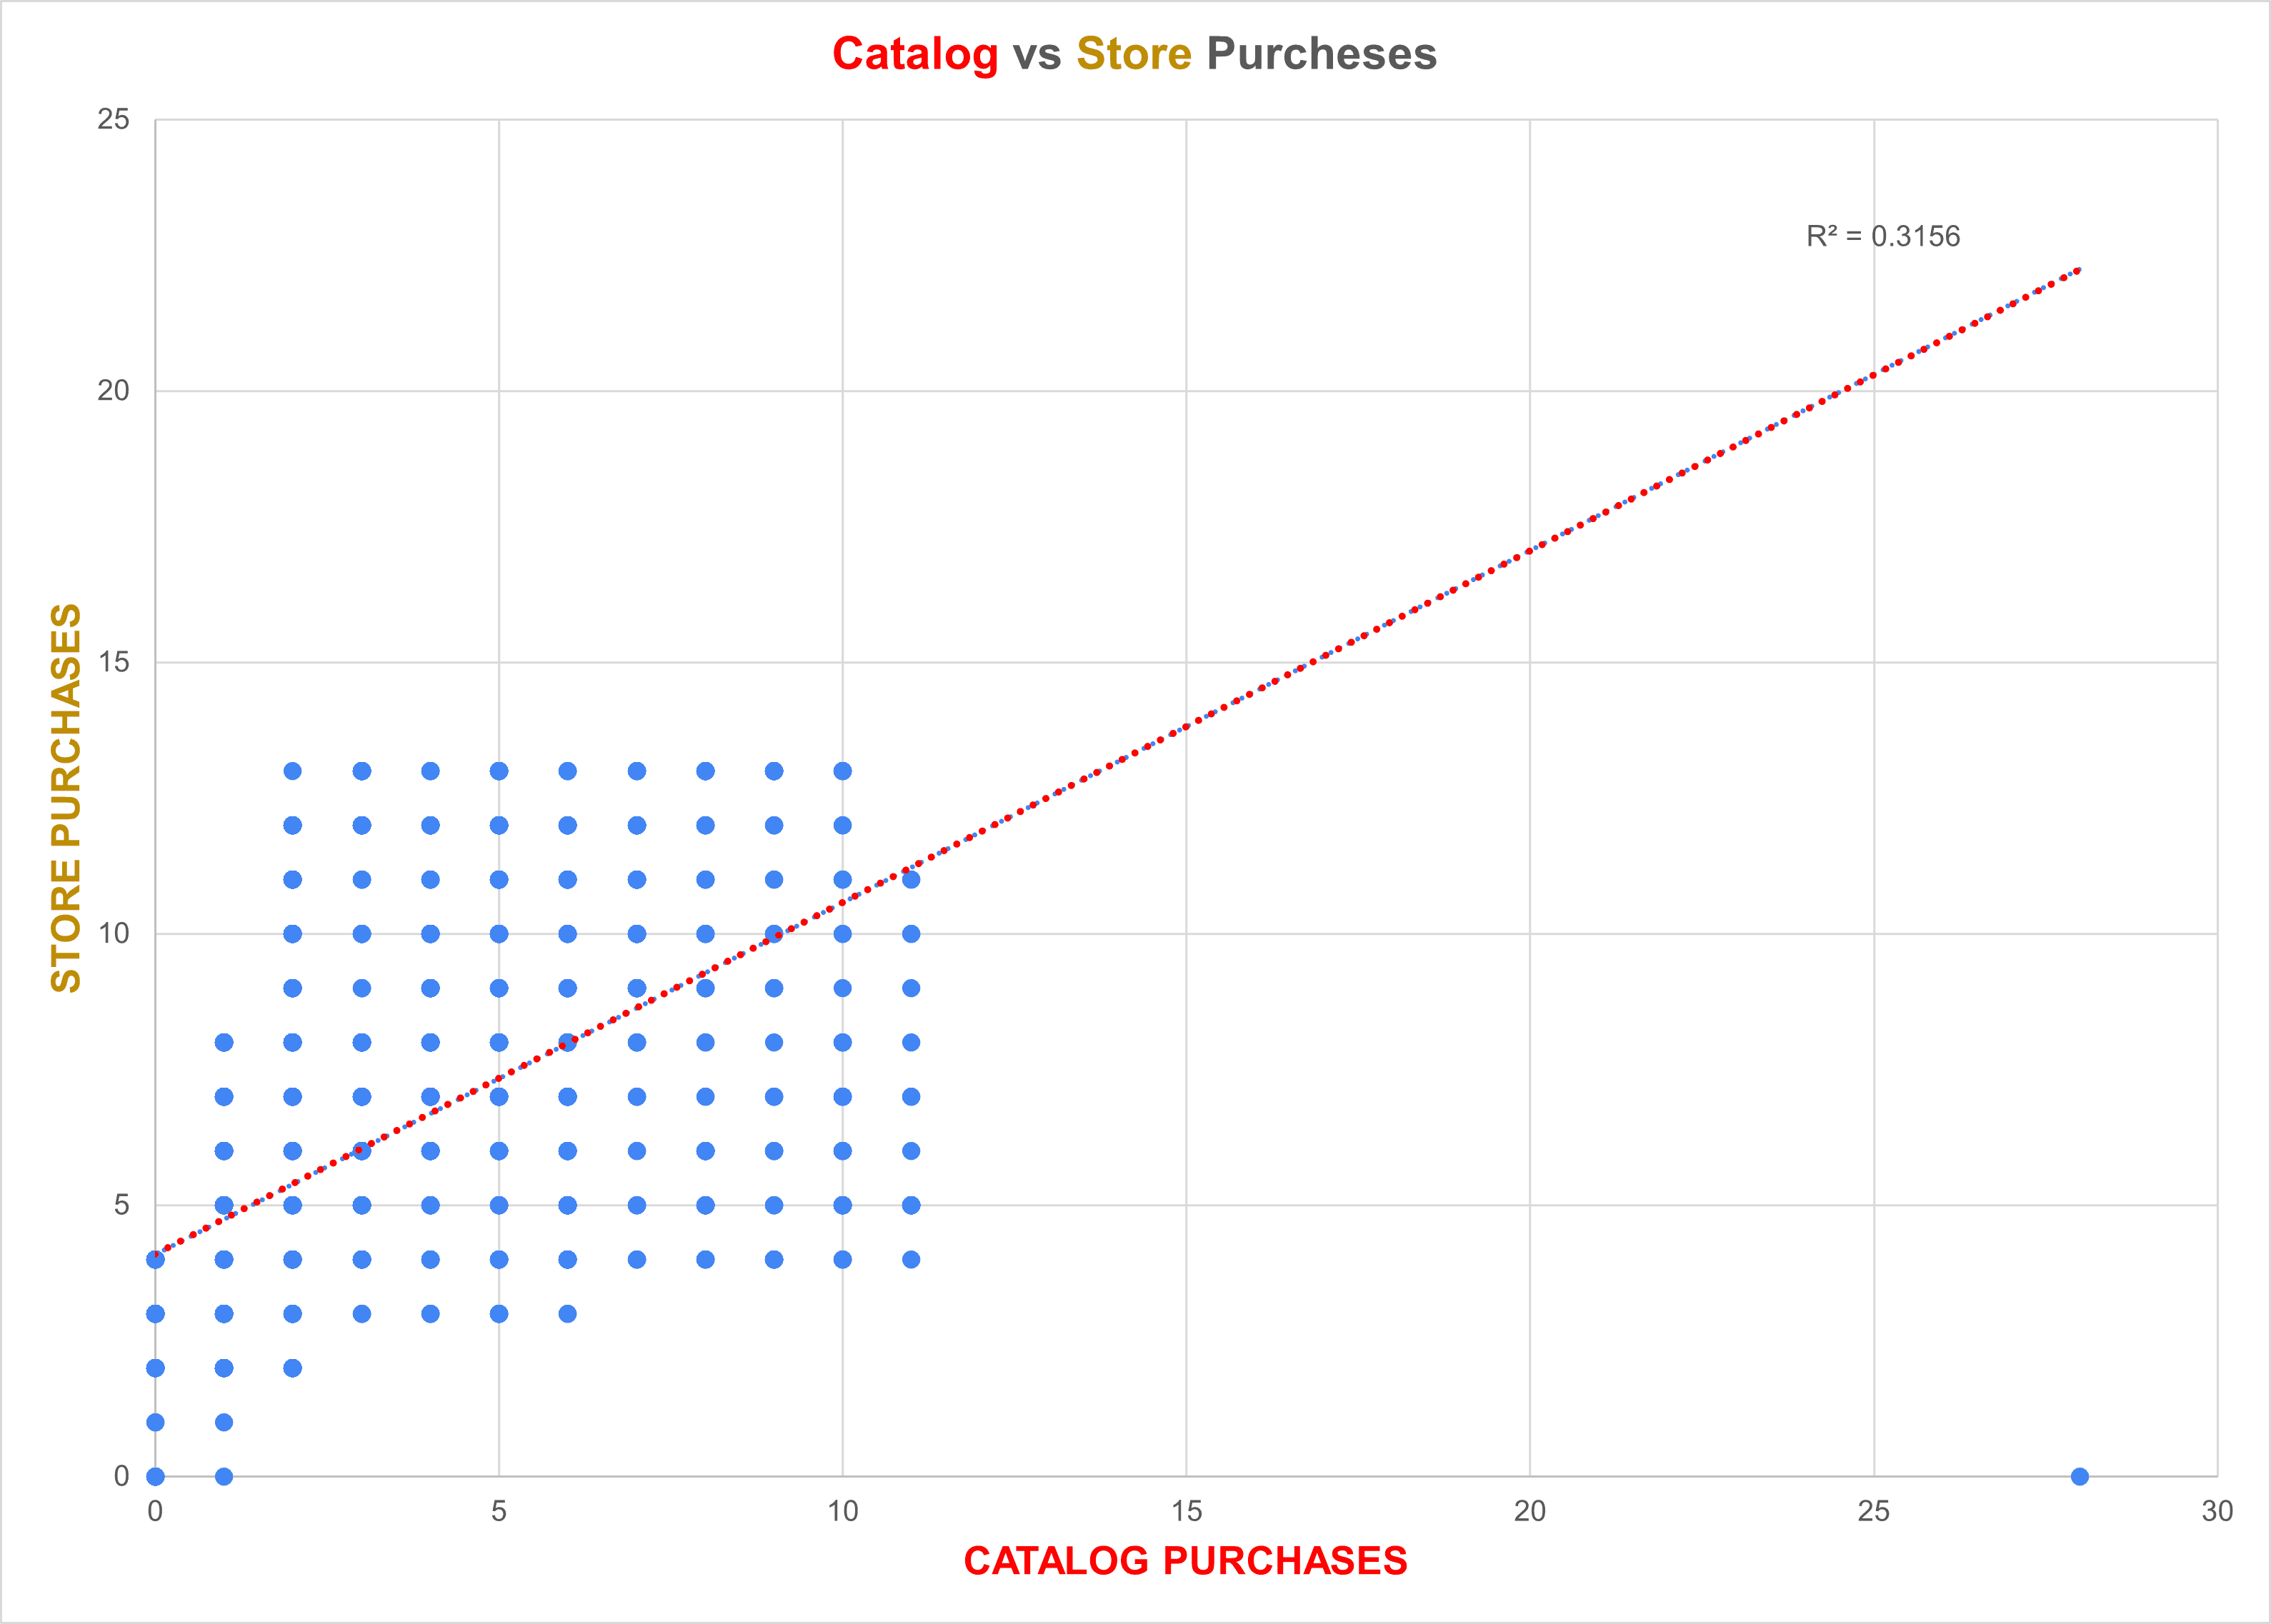
There is a moderate positive correlation (R² = 0.3156). This means customers who purchase through catalogs are likely to also shop in-store. These two channels may attract traditional shoppers who value physical browsing before purchase.

3. Is there a correlation between web and store purchases?
A weaker but noticeable correlation exists (R² = 0.2506). Some customers split purchases between web and store, but others clearly prefer one over the other. This suggests distinct user segments — ideal for tailored marketing.

4. Is there a correlation between web and catalog purchases?
This is the weakest relationship among the three (R² = 0.1714). It indicates that web and catalog attract very different customer types. Businesses should design separate strategies for each channel rather than assuming overlap.
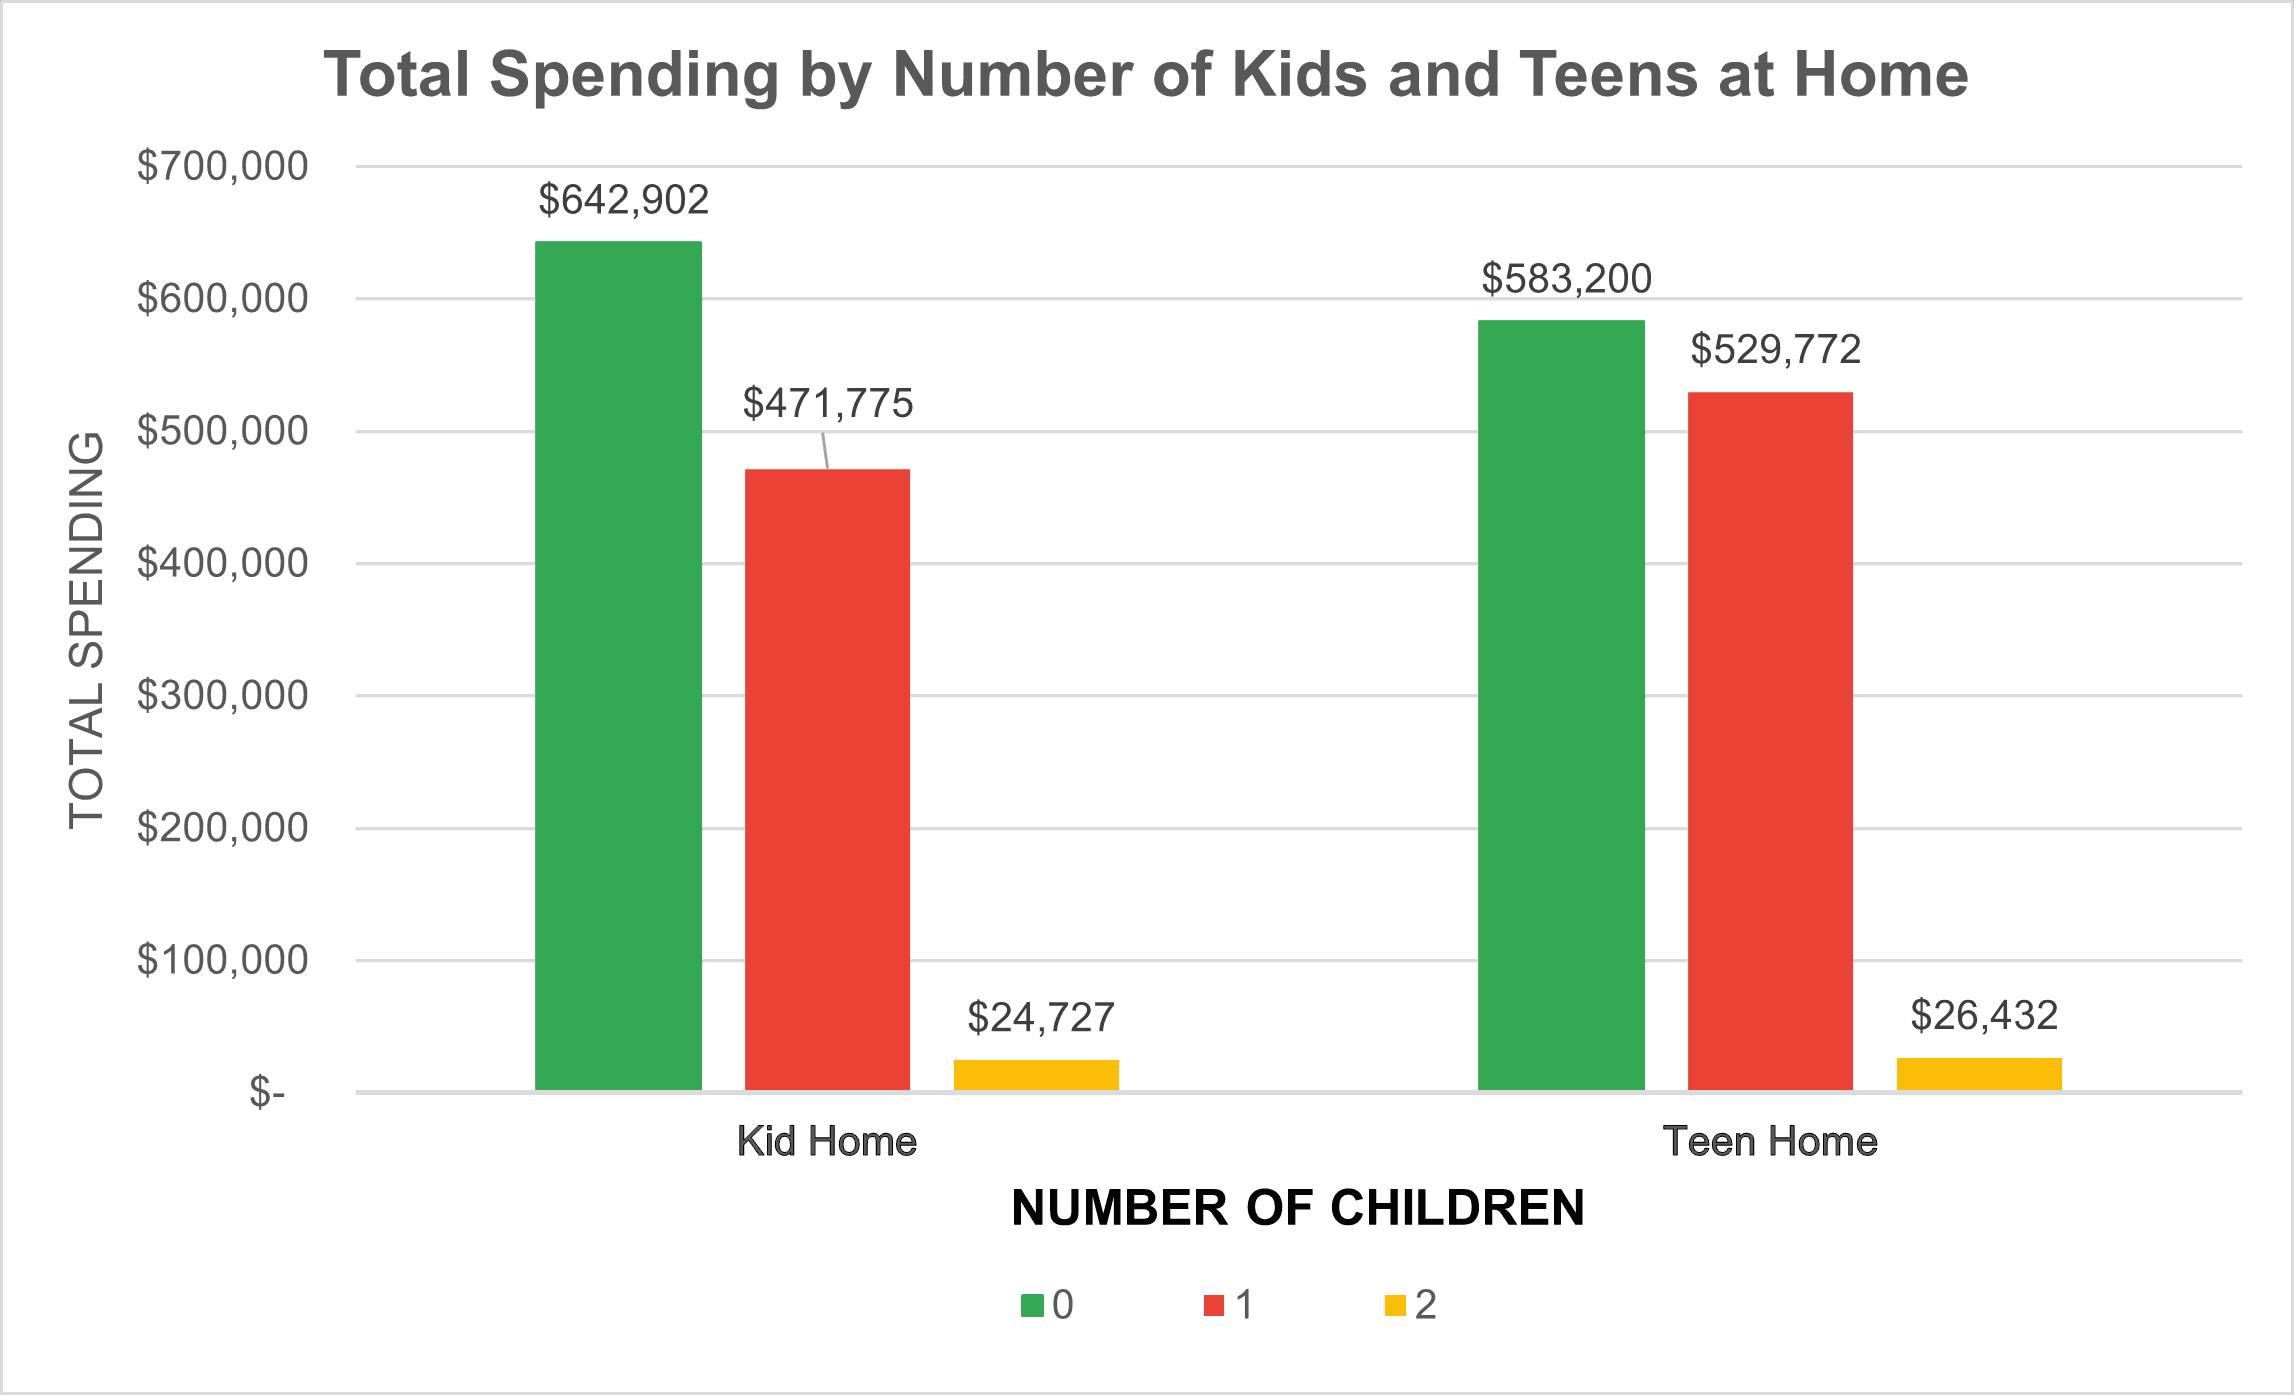
5. How does the number of kids or teens at home affect total spending?
Smaller households spend more. Households with zero children spent over $640,000, while those with two children spent only $24,727. This inverse relationship suggests larger families are more budget-conscious or buy in bulk elsewhere, while smaller households may spend more on convenience or delivery.
Main Takeaways
This project uncovered real patterns that go beyond numbers. Here’s what stood out the most:
In-store purchases remain dominant — Despite the rise of digital platforms, customers still favor the physical shopping experience. Businesses ignoring brick-and-mortar strategies may miss key revenue.
Smaller households spend significantly more — Individuals and couples without children drive the highest total spending, revealing a strong link between household size and purchasing behavior.
Catalog and store shoppers overlap — There’s a moderate correlation between catalog and in-store purchases, making them ideal for bundled promotions and dual-channel campaigns.
Web shoppers are unique — The weak correlation between web and catalog purchases suggests distinct user profiles. Each channel requires a tailored approach to maximize impact..

Personal Reflections
This project strengthened both my technical skills—working with pivot tables, charts, and data filtering—and my ability to think critically about what the data represents. It was a powerful reminder that behind every number is a real person, often a household with unique needs and behaviors.
It also reinforced my passion for data analysis and my drive to help businesses make smarter, people-focused decisions. With the right insights, companies can grow not only in numbers but in reputation and customer loyalty as well.

CALL TO ACTION
I’m currently seeking a permanent position or freelance project in data analytics. If you're looking for someone who can turn complex data into clear, actionable insights — I’d love to collaborate and help drive smarter decisions for your organization.
Feel free to reach out:
🔗 LinkedIn
📧 Email: data@lubobali.com
Let’s dig into the data — together.


2. Is there a correlation between catalog and store purchases?
There is a moderate positive correlation (R² = 0.3156). This means customers who purchase through catalogs are likely to also shop in-store. These two channels may attract traditional shoppers who value physical browsing before purchase.
3. Is there a correlation between web and store purchases?
A weaker but noticeable correlation exists (R² = 0.2506). Some customers split purchases between web and store, but others clearly prefer one over the other. This suggests distinct user segments — ideal for tailored marketing.
4. Is there a correlation between web and catalog purchases?
This is the weakest relationship among the three (R² = 0.1714). It indicates that web and catalog attract very different customer types. Businesses should design separate strategies for each channel rather than assuming overlap.
5. How does the number of kids or teens at home affect total spending?
Smaller households spend more. Households with zero children spent over $640,000, while those with two children spent only $24,727. This inverse relationship suggests larger families are more budget-conscious or buy in bulk elsewhere, while smaller households may spend more on convenience or delivery.
Main Takeaways
This project uncovered real patterns that go beyond numbers. Here’s what stood out the most:
In-store purchases remain dominant — Despite the rise of digital platforms, customers still favor the physical shopping experience. Businesses ignoring brick-and-mortar strategies may miss key revenue.
Smaller households spend significantly more — Individuals and couples without children drive the highest total spending, revealing a strong link between household size and purchasing behavior.
Catalog and store shoppers overlap — There’s a moderate correlation between catalog and in-store purchases, making them ideal for bundled promotions and dual-channel campaigns.
Web shoppers are unique — The weak correlation between web and catalog purchases suggests distinct user profiles. Each channel requires a tailored approach to maximize impact..
Personal Reflections
This project strengthened both my technical skills—working with pivot tables, charts, and data filtering—and my ability to think critically about what the data represents. It was a powerful reminder that behind every number is a real person, often a household with unique needs and behaviors.
It also reinforced my passion for data analysis and my drive to help businesses make smarter, people-focused decisions. With the right insights, companies can grow not only in numbers but in reputation and customer loyalty as well.
CALL TO ACTION
I’m currently seeking a permanent position or freelance project in data analytics. If you're looking for someone who can turn complex data into clear, actionable insights — I’d love to collaborate and help drive smarter decisions for your organization.
Feel free to reach out:
🔗 LinkedIn
📧 Email: lubobali@yahoo.com
Let’s dig into the data — together.