How I Built a Contractor CVS Data Pipeline Using Flask, PostgreSQL, and Python
How I Built a Contractor CVS Data Pipeline Using Flask, PostgreSQL, and Python


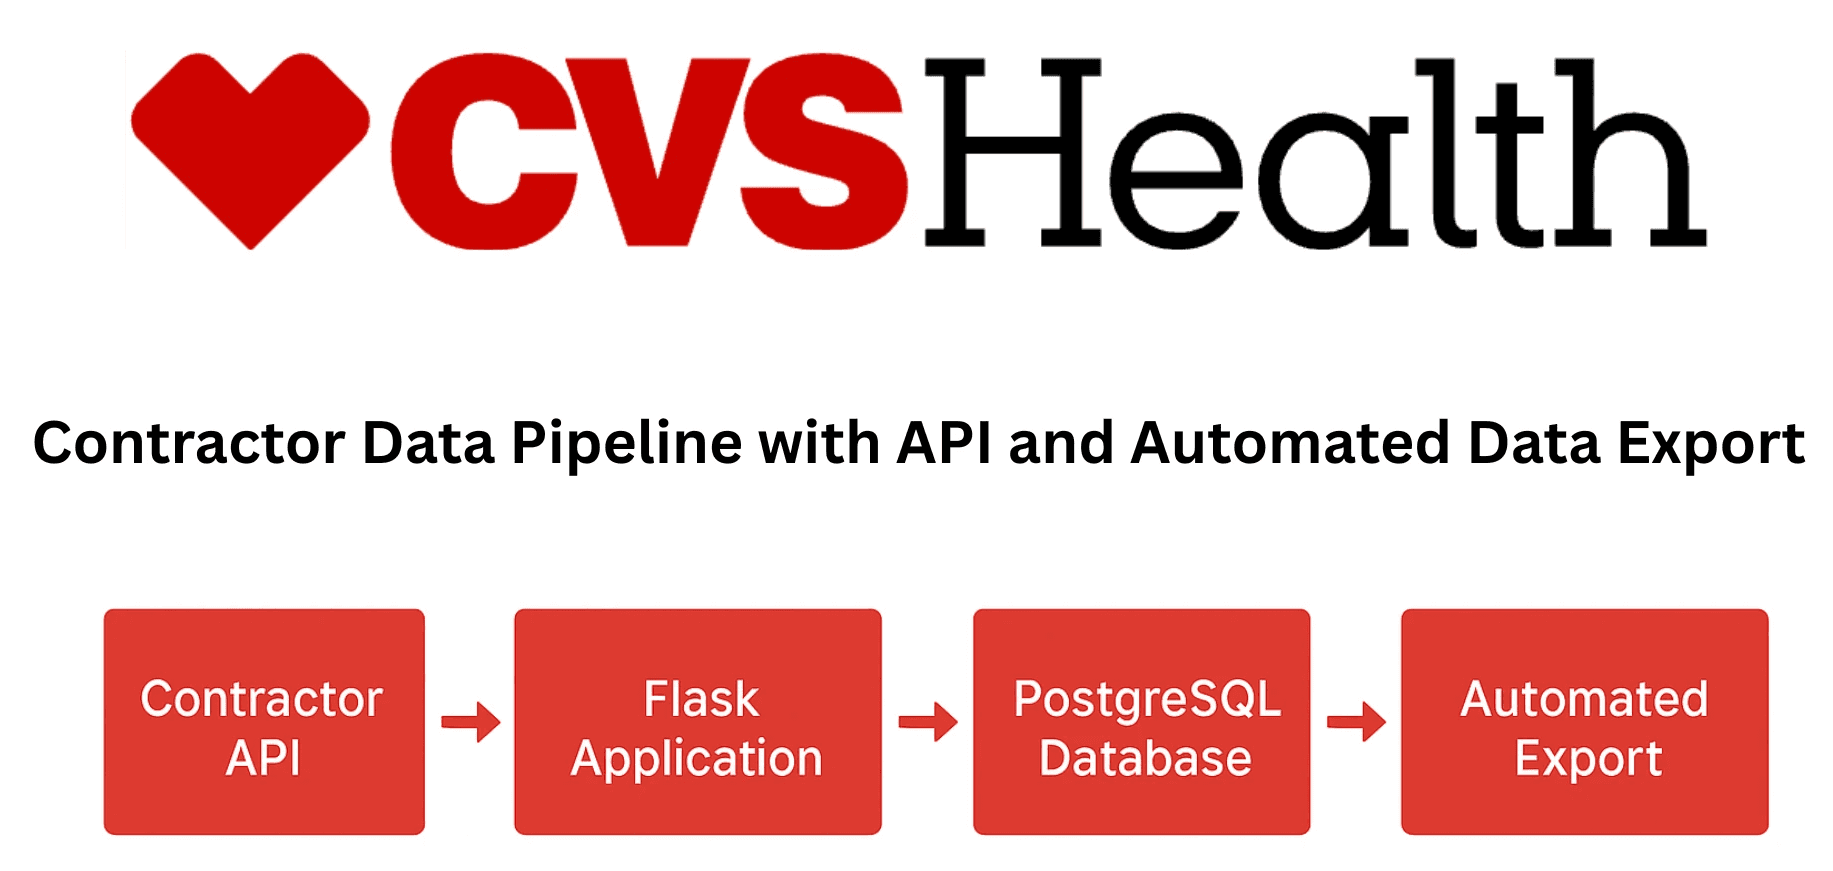
Full pipeline flow – from data ingestion to dashboard output
This project isn’t just a demo — it’s a fully automated backend pipeline I built from scratch to simulate how a company like CVS might manage contractor data. It showcases the full data engineering lifecycle from ingestion to insight.
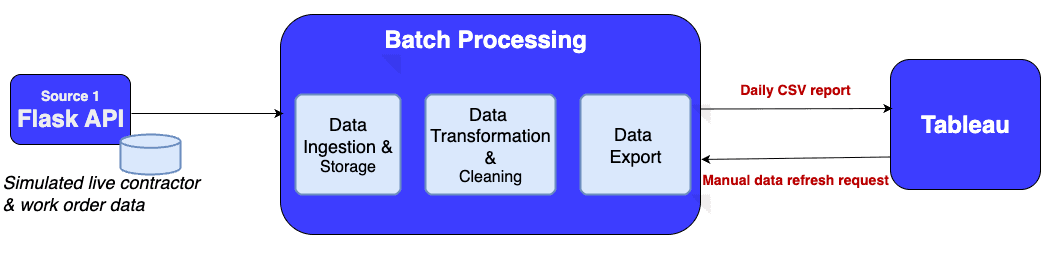
I developed a Flask API with multiple endpoints to simulate live contractor and work order data flowing into the system.
Data is stored in a realistic PostgreSQL schema, with records inserted and managed via Python scripts.
A Python automation extracts, cleans, and exports daily snapshots of contractor data into CSV files without manual intervention.
These exports connect directly to a Tableau dashboard that updates dynamically to visualize contractor performance in real time.
The entire pipeline runs locally, handling data freshness and file management, and is structured for easy extension into scalable, cloud-based real-time systems.
This project demonstrates my ability to design, build, and maintain reliable, end-to-end data pipelines that turn raw data into actionable business insights seamlessly.
Full pipeline flow – from data ingestion to dashboard output
This project isn’t just a demo — it’s a fully automated backend pipeline I built from scratch to simulate how a company like CVS might manage contractor data. It showcases the full data engineering lifecycle from ingestion to insight.
I developed a Flask API with multiple endpoints to simulate live contractor and work order data flowing into the system.
Data is stored in a realistic PostgreSQL schema, with records inserted and managed via Python scripts.
A Python automation extracts, cleans, and exports daily snapshots of contractor data into CSV files without manual intervention.
These exports connect directly to a Tableau dashboard that updates dynamically to visualize contractor performance in real time.
The entire pipeline runs locally, handling data freshness and file management, and is structured for easy extension into scalable, cloud-based real-time systems.
This project demonstrates my ability to design, build, and maintain reliable, end-to-end data pipelines that turn raw data into actionable business insights seamlessly.

All the core logic for this pipeline — including the Flask API, data insertion script, and export automation — is available in the GitHub repository below:
This includes:
app.py– Flask API with endpointsinsert_data.py– Inserts mock contractor data into PostgreSQLexport_to_csv.py– Exports daily contractor snapshots to CSV
The code is modular, clean, and easy to extend or integrate into any real-world backend.

To The final step in the pipeline connects the exported contractor data to a live Tableau dashboard.
The CSV file generated in Step 3 (contractors_export.csv) is used as the data source for visualizing contractor performance metrics like:
Average cost per contractor
Response times
Overdue orders
This demonstrates how structured backend data can be delivered in a BI-ready format, closing the loop from ingestion to insight.
Step 4: Dashboard Connection
# pipeline/export_to_csv.py

cur.execute("SELECT * FROM contractors")
rows = cur.fetchall()

with open("pipeline/contractors_export.csv", "w", newline="") as file:
    writer = csv.writer(file)
    writer.writerow(["name", "avg_cost", "overdue_orders", "response_time"])
    writer.writerows(rows)
Step 3: Scheduled Data Export
To make the data usable for business intelligence tools like Tableau, I created a Python script that automatically exports fresh snapshots of contractor data into CSV format.
The script reads from the PostgreSQL contractors table and writes the result to a CSV file that’s updated on a daily basis. This simulates the type of scheduled export jobs that companies like CVS rely on for reporting and analysis.
# pipeline/insert_data.py

with open("pipeline/mock_data.csv", "r") as file:
    reader = csv.reader(file)
    next(reader)  # Skip header
    for row in reader:
        cur.execute(
            "INSERT INTO contractors (name, avg_cost, overdue_orders, response_time) VALUES (%s, %s, %s, %s)",
            row
        )
Step 2: PostgreSQL Database Storage
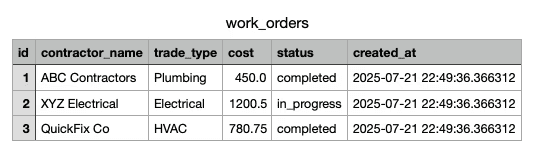
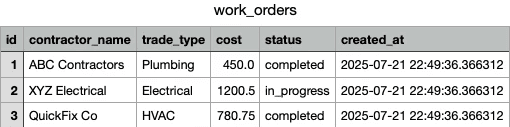
The data captured through the API is stored in a PostgreSQL database using three manually created tables:
contractorswork_orderslocations
Each table is designed with a realistic schema to reflect how a facilities management system like CVS might organize contractor and service data. While this project focuses on reading data through the API, the schema is fully ready for insert and update operations as well.
This database layer ensures that data is stored in a structured, queryable format — forming the backbone for downstream analysis and automation.
Step 1: API Simulation with Flask
The pipeline begins with a Flask application that simulates real-world contractor activity by accepting and serving data through REST API endpoints:
/contractors– retrieves contractor records/work_orders– (planned) handles work order submissions/locations– (planned) manages service location details
These endpoints mimic how external systems (like facilities tools or contractor portals) would push or pull data from a centralized backend. This makes it ideal for simulating production-like behavior without relying on external vendors.
@app.route("/contractors", methods=["GET"])
def get_contractors():
    conn = get_db_connection()
    cur = conn.cursor()
    cur.execute("SELECT * FROM contractors LIMIT 10;")
    rows = cur.fetchall()
    cur.close()
    conn.close()
    return jsonify(rows)
Step-by-Step Pipeline Breakdown
Step 1: API Simulation with Flask
The pipeline begins with a Flask application that simulates real-world contractor activity by accepting and serving data through REST API endpoints:
/contractors– retrieves contractor records/work_orders– (planned) handles work order submissions/locations– (planned) manages service location details
These endpoints mimic how external systems (like facilities tools or contractor portals) would push or pull data from a centralized backend. This makes it ideal for simulating production-like behavior without relying on external vendors.
@app.route("/contractors", methods=["GET"])
def get_contractors():
    conn = get_db_connection()
    cur = conn.cursor()
    cur.execute("SELECT * FROM contractors LIMIT 10;")
    rows = cur.fetchall()
    cur.close()
    conn.close()
    return jsonify(rows)
Step 2: PostgreSQL Database Storage
The data captured through the API is stored in a PostgreSQL database using three manually created tables:
contractorswork_orderslocations
Each table is designed with a realistic schema to reflect how a facilities management system like CVS might organize contractor and service data. While this project focuses on reading data through the API, the schema is fully ready for insert and update operations as well.
This database layer ensures that data is stored in a structured, queryable format — forming the backbone for downstream analysis and automation.
# pipeline/insert_data.py

with open("pipeline/mock_data.csv", "r") as file:
    reader = csv.reader(file)
    next(reader)  # Skip header
    for row in reader:
        cur.execute(
            "INSERT INTO contractors (name, avg_cost, overdue_orders, response_time) VALUES (%s, %s, %s, %s)",
            row
        )

What This Project Demonstrates
This project simulates a realistic contractor management system — built entirely from scratch — to demonstrate backend automation and data engineering fundamentals. It shows how clean, structured data can be generated, stored, and delivered automatically for analysis or dashboarding.
Here’s what it demonstrates:
Real-world simulation of a backend system
Simulates incoming contractor and work order data through an API, just like real vendor systems at companies like CVS.Data flow automation
Automates the full pipeline — from ingestion to storage to daily export — using Python and PostgreSQL.Integration-ready data delivery for BI tools
Outputs clean CSVs ready for use in Tableau, Power BI, or any other analytics platform.

Step-by-Step Pipeline Breakdown