Full repo 👉 GitHub


CVS Contractor Performance: Uncovering the Hidden Costs of Maintenance with SQL & Tableau
CVS Contractor Performance: Uncovering the Hidden Costs of Maintenance with SQL & Tableau

Why THIS Project?
Facilities maintenance costs can silently drain a company’s budget — especially when contractor performance isn’t measured closely. This project, "VS Contractor Performance: Uncovering the Hidden Costs of Maintenance with SQL & Tableau," was designed to simulate how a large organization like CVS Health might track and visualize these hidden expenses.
Using mock data and real SQL queries, I analyzed contractor response times, overdue work orders, and average costs per trade to identify patterns that may otherwise go unnoticed. The goal was to build a clear, interactive dashboard that highlights inefficiencies and helps facilities managers make smarter budgeting decisions.
This project not only demonstrates my skills in SQL and Tableau, but also my ability to think like a data analyst supporting real-world operations—uncovering actionable insights from routine service data.

Want to See How Real Budgeting Starts With SQL?
If you’ve ever wondered how big companies like CVS track maintenance spending, vendor performance, and operational budgets — this project gives you a real-world glimpse.
You’ll explore how raw work order data can be transformed into executive-level insights using SQL and Tableau. Whether you’re into data analytics, facilities operations, or just want to see how a solid dashboard comes together from scratch — this walkthrough is for you.

What & Where of the Dataset
To support this project, I manually created and populated three PostgreSQL tables — contractors, locations, and work_orders. These tables simulate a realistic facilities management system, modeled after how large organizations like CVS might track vendor activity, property details, and service requests.
I designed the table schemas to include essential information about contractor performance, site locations, and maintenance workflows. The data was manually entered and tailored to match real-world formats so I could analyze costs, delays, and efficiency across different trades and regions.
This setup gave me full control over the data structure and relationships, which made it easier to explore key performance metrics using SQL and build a meaningful executive dashboard in Tableau.
Live Executive Dashboard:
Contractor Performance at a Glance
Key Insights from the Dashboard
This dashboard reveals key performance trends across contractors and regions. The average overdue rate sits at 18%, with some vendors missing deadlines more than half the time. The average work order cost is around $1,340, but varies by region — the Midwest being the most expensive. Response time also shows major variability, with the fastest contractors averaging just over 1 hour, while the slowest stretch past 2.5 hours. These insights help identify which vendors consistently underperform and where cost controls are most needed.
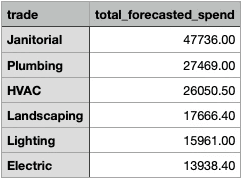
What is the total forecasted spend per trade for Q1 2025?
This query calculates the total projected maintenance spend from January through March 2025, grouped by trade.
Insight:
Janitorial services are expected to incur the highest spend in Q1, totaling over $47,000, followed by Plumbing and HVAC. This suggests that routine cleaning and critical infrastructure repairs represent the largest early-year maintenance priorities. Trades like Lighting and Electric show comparatively lower spend, indicating they may be more seasonal or reactive in nature.
SELECT
    trade,
    SUM(forecasted_spend) AS total_forecasted_spend
FROM
    monthly_budget_forecast
WHERE
    month >= '2025-01-01' AND month < '2025-04-01'
GROUP BY
    trade
ORDER BY
    total_forecasted_spend DESC;

SELECT
    contractor,
    SUM(unplanned_cost) AS total_unplanned_cost
FROM
    monthly_budget_forecast
WHERE
    month >= '2025-01-01' AND month < '2025-04-01'
GROUP BY
    contractor
ORDER BY
    total_unplanned_cost DESC;
Which contractors had the highest unplanned costs in Q1 2025?
This query sums up all unplanned maintenance costs per contractor during the first quarter of 2025.
Insight:
EcoPlumb, GreenScape, and CleanCo account for the majority of unexpected maintenance expenses in Q1. These unplanned costs can strain facility budgets and indicate poor planning, reactive work styles, or frequent emergencies. Identifying contractors with high unplanned costs helps prioritize better scheduling, stronger SLAs, or potential replacements in future contracts.
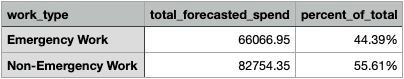
What is the total emergency vs. non-emergency forecasted spend in Q1 2025?
This query compares how much of the Q1 2025 maintenance budget is allocated to emergency work versus planned, non-emergency work.
Insight:
Emergency repairs account for over 44% of the total forecasted spend, totaling more than $66,000. While non-emergency work makes up the remaining 56%, the high percentage of urgent, reactive tasks suggests that nearly half of all Q1 spending is unplanned. This highlights an opportunity for better scheduling, preventive maintenance, and vendor accountability to reduce emergency costs over time.
WITH totals AS (
    SELECT
        emergency_wo,
        SUM(forecasted_spend) AS total_forecasted_spend
    FROM
        monthly_budget_forecast
    WHERE
        month >= '2025-01-01' AND month < '2025-04-01'
    GROUP BY
        emergency_wo
),
grand_total AS (
    SELECT SUM(total_forecasted_spend) AS total_q1_spend FROM totals
)
SELECT
    CASE
        WHEN t.emergency_wo = TRUE THEN 'Emergency Work'
        ELSE 'Non-Emergency Work'
    END AS work_type,
    t.total_forecasted_spend,
    CONCAT(ROUND(t.total_forecasted_spend / g.total_q1_spend * 100, 2), ' % ') AS percent_of_total
FROM
    totals t,
    grand_total g
ORDER BY
    work_type;
The Big Picture
This project was created entirely from scratch — including the simulated mock data, the SQL analysis, and the interactive Tableau dashboard — to demonstrate how data can drive smarter decisions in facilities management.
It shows how even simple, structured datasets can uncover:
Which trades and contractors are driving the highest costs
How much spend is due to emergency vs. planned work
Where unplanned expenses may be signaling inefficiencies
While this dashboard focuses on manually created data, it sets the foundation for something much bigger. In my next project, I’ll take this one step further by building a real Contractor Data Pipeline with API and Automated Data Export — showing how this type of data can be generated, stored, and updated continuously in a live system.
Together, these two projects offer a full picture: from pipeline to insights.

Are You Ready for Budgeting at CVS? Let’s Go.
If you’ve made it this far, you’ve seen how a data-driven approach can simplify even the most complex budgeting challenges in facilities management.
I’d love to talk more about how I can bring this same mindset — from building SQL queries to designing executive dashboards — to real CVS projects.
📨 Email: data@lubobali.com
🔗 Website: www.lubobali.com
💼 LinkedIn: linkedin.com/in/lubo-bali

The Big Picture
This project was created entirely from scratch — including the simulated mock data, the SQL analysis, and the interactive Tableau dashboard — to demonstrate how data can drive smarter decisions in facilities management.
It shows how even simple, structured datasets can uncover:
Which trades and contractors are driving the highest costs
How much spend is due to emergency vs. planned work
Where unplanned expenses may be signaling inefficiencies
While this dashboard focuses on manually created data, it sets the foundation for something much bigger. In my next project, I’ll take this one step further by building a real Contractor Data Pipeline with API and Automated Data Export — showing how this type of data can be generated, stored, and updated continuously in a live system.
Together, these two projects offer a full picture: from pipeline to insights.
What is the total emergency vs. non-emergency forecasted spend in Q1 2025?
This query compares how much of the Q1 2025 maintenance budget is allocated to emergency work versus planned, non-emergency work.
Insight:
Emergency repairs account for over 44% of the total forecasted spend, totaling more than $66,000. While non-emergency work makes up the remaining 56%, the high percentage of urgent, reactive tasks suggests that nearly half of all Q1 spending is unplanned. This highlights an opportunity for better scheduling, preventive maintenance, and vendor accountability to reduce emergency costs over time.
WITH totals AS (
    SELECT
        emergency_wo,
        SUM(forecasted_spend) AS total_forecasted_spend
    FROM
        monthly_budget_forecast
    WHERE
        month >= '2025-01-01' AND month < '2025-04-01'
    GROUP BY
        emergency_wo
),
grand_total AS (
    SELECT SUM(total_forecasted_spend) AS total_q1_spend FROM totals
)
SELECT
    CASE
        WHEN t.emergency_wo = TRUE THEN 'Emergency Work'
        ELSE 'Non-Emergency Work'
    END AS work_type,
    t.total_forecasted_spend,
    CONCAT(ROUND(t.total_forecasted_spend / g.total_q1_spend * 100, 2), ' % ') AS percent_of_total
FROM
    totals t,
    grand_total g
ORDER BY
    work_type;
Are You Ready for Budgeting at CVS? Let’s Go.
If you’ve made it this far, you’ve seen how a data-driven approach can simplify even the most complex budgeting challenges in facilities management.
I’d love to talk more about how I can bring this same mindset — from building SQL queries to designing executive dashboards — to real CVS projects.
📨 Email: data@lubobali.com
🔗 Website: www.lubobali.com
💼 LinkedIn: linkedin.com/in/lubo-bali

What is the total forecasted spend per trade for Q1 2025?
This query calculates the total projected maintenance spend from January through March 2025, grouped by trade.
Insight:
Janitorial services are expected to incur the highest spend in Q1, totaling over $47,000, followed by Plumbing and HVAC. This suggests that routine cleaning and critical infrastructure repairs represent the largest early-year maintenance priorities. Trades like Lighting and Electric show comparatively lower spend, indicating they may be more seasonal or reactive in nature.
SELECT
    contractor,
    SUM(unplanned_cost) AS total_unplanned_cost
FROM
    monthly_budget_forecast
WHERE
    month >= '2025-01-01' AND month < '2025-04-01'
GROUP BY
    contractor
ORDER BY
    total_unplanned_cost DESC;
SELECT
    trade,
    SUM(forecasted_spend) AS total_forecasted_spend
FROM
    monthly_budget_forecast
WHERE
    month >= '2025-01-01' AND month < '2025-04-01'
GROUP BY
    trade
ORDER BY
    total_forecasted_spend DESC;
What is the total forecasted spend per trade for Q1 2025?
This query calculates the total projected maintenance spend from January through March 2025, grouped by trade.
Insight:
Janitorial services are expected to incur the highest spend in Q1, totaling over $47,000, followed by Plumbing and HVAC. This suggests that routine cleaning and critical infrastructure repairs represent the largest early-year maintenance priorities. Trades like Lighting and Electric show comparatively lower spend, indicating they may be more seasonal or reactive in nature.
Key Insights from the Dashboard
This dashboard reveals key performance trends across contractors and regions. The average overdue rate sits at 18%, with some vendors missing deadlines more than half the time. The average work order cost is around $1,340, but varies by region — the Midwest being the most expensive. Response time also shows major variability, with the fastest contractors averaging just over 1 hour, while the slowest stretch past 2.5 hours. These insights help identify which vendors consistently underperform and where cost controls are most needed.
Live Executive Dashboard:
Contractor Performance at a Glance
What & Where of the Dataset
ITo support this project, I manually created and populated three PostgreSQL tables — contractors, locations, and work_orders. These tables simulate a realistic facilities management system, modeled after how large organizations like CVS might track vendor activity, property details, and service requests.
I designed the table schemas to include essential information about contractor performance, site locations, and maintenance workflows. The data was manually entered and tailored to match real-world formats so I could analyze costs, delays, and efficiency across different trades and regions.
This setup gave me full control over the data structure and relationships, which made it easier to explore key performance metrics using SQL and build a meaningful executive dashboard in Tableau.

Want to See How Real Budgeting Starts With SQL?
If you’ve ever wondered how big companies like CVS track maintenance spending, vendor performance, and operational budgets — this project gives you a real-world glimpse.
You’ll explore how raw work order data can be transformed into executive-level insights using SQL and Tableau. Whether you’re into data analytics, facilities operations, or just want to see how a solid dashboard comes together from scratch — this walkthrough is for you.
Why I Did This Project
Facilities maintenance costs can silently drain a company’s budget — especially when contractor performance isn’t measured closely. This project, "VS Contractor Performance: Uncovering the Hidden Costs of Maintenance with SQL & Tableau," was designed to simulate how a large organization like CVS Health might track and visualize these hidden expenses.
Using mock data and real SQL queries, I analyzed contractor response times, overdue work orders, and average costs per trade to identify patterns that may otherwise go unnoticed. The goal was to build a clear, interactive dashboard that highlights inefficiencies and helps facilities managers make smarter budgeting decisions.
This project not only demonstrates my skills in SQL and Tableau, but also my ability to think like a data analyst supporting real-world operations—uncovering actionable insights from routine service data.